 Dave Taylor - Software Engineer
Visual Graphing to See Relationships
I have been working with Canvas 2D and WebGL recently and have been using Maths I never expected to see again once I left school. One thing that has been really useful when turning mathematical functions in to something visual is to see a graph representation of the values.
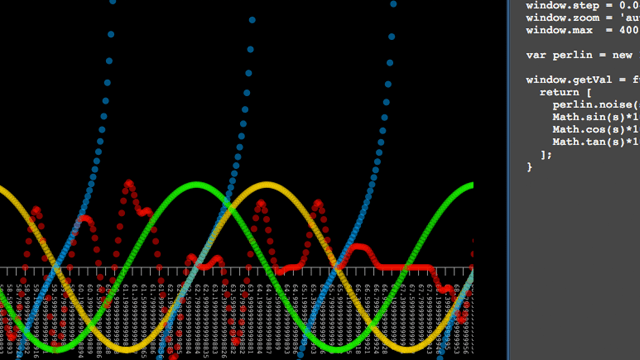
I have created a [simple graphing playground](/teststation/creative-
js/grapher/2d.html) to test out these functions and compare them to
each other. You can see below the difference between the sin, cos
and tan functions alongside the ImprovedNoise generator built in
to Three.js.